"Reporting Agent" - The revolution in your reports
If you already use Sigalei, you can now have an agent that builds reports the way you need them. It was born with a clear mission: to process large volumes of data and transform them into professional summaries and charts ready for sending.
However, what started as a communication tool has evolved. Today, it not only "writes and sends emails", but masters the complexity of information to offer simple controls and highly reliable results.
And the best part, you do not need to know programming to enjoy this resource. Just remember that the assistant is literal and the secret lies in how you talk to the AI.
Liked it and want to know more about the Newsletter Agent? Check out this article.
1. How the agent works or why not use a common chatbot?
You may have already noticed that generic AIs (based purely on statistical inference) can "hallucinate" or provide out-of-context answers. However, for those working in critical areas such as regulatory, legal, or government affairs, a 1% error can cost a job or a million-dollar fine.
And this is where Sigalei's agent stands out. Its operation is based on reducing the complexity of information for the generation of reports and analyses through the following mechanisms:
1.1. Configuration process
The user can generate analyses by completing six simple steps, inserting specific points that do not need to be complex or extensive.
1.2. Hybrid engines: statistical and deterministic
The differentiator of this agent is that it does not operate solely based on the statistical inference of an LLM (large language model).
It uses a statistical engine for pattern recognition and also generates deterministic code (a small software program) underneath each functionality.
Thus, instead of just "guessing" the next word, our agent processes data accurately and predictably.
1.3. Reliability and semantics
To avoid AI hallucinations, the agent uses a semantic layer and a dictionary of previously instantiated objects, with specific definitions of the company's context (its projects, its themes, its terminology, etc.).
This ensures that the result is consistent and does not require constant review by the user.
1.4. Automation
The system is capable of automatically sending reports and analyses via email.
1.5. Interface
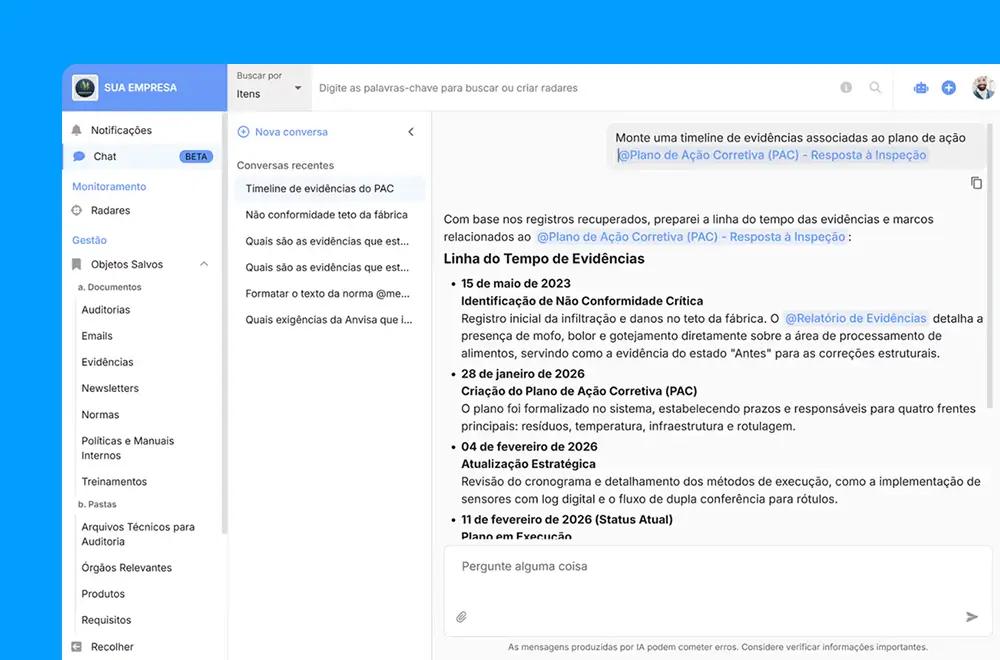
The user interacts with the agent through a conversational interface or by filling out filters, and the agent can even be "summoned" (using @agent) within documents to assist in writing texts or creating charts.
And to make the most of all the functionalities of this resource, activate your Newsletter by "installing the agent", and define the days and times you wish to receive the information in your email.
2. Best practices for the perfect report
Apply the rules below to create an analysis block with a clean look that works perfectly in systems like Outlook or Gmail:
- Contextualize the section: AI tends to be polite and include texts and greetings. For a clean look, state that the excerpt is part of a larger document.
- The "magic word" for corporate emails: systems like Outlook block complex charts, and to prevent this from happening, activate the AI's internal knowledge to generate safe code.
- Use "cards" for visual organization: to avoid leaving the text floating on a white background, use the concept of "cards" (stylized boxes) to bring elegance and hierarchy to the information.
- Control the length: AIs have no automatic notion of reading time. Set clear limits so your board only receives the essentials.
- Divide and conquer: if you need a chart, a summary, and a list, create three different blocks. Do not request everything in the same block, as the assistant processes blocks simultaneously, making generation much faster.
To learn more about the subject, check out Newsletter with the intelligent agent.
3. Cross-referenced and regulatory analysis
Sometimes, your regulatory analysis requires more than raw numbers: the agent needs to cross-reference back office data, group them, and deliver an impactful visual narrative, such as weekly summaries or charts.
3.1. Practical examples
Example 1: Filter + Count = Chart
“This section is part of an email about the next month. I need a chart that filters all government base projects, cross-references them with their committees of origin, and shows me a visual ranking of the 3 most active committees in this group. The chart should be vertical, 100% compatible with Gmail and Outlook, in pure HTML. I want the visualization packaged in a card. Nothing besides the visualization, no text.”
Example 2: Enrichment + Aggregation = Scenario summary
“I need an executive scenario summary for an email newsletter. Evaluate the summaries of the presented bills and identify the 5 most repeated controversial themes of the week. Then, build a stylized list (compatible with Outlook/Gmail) explaining in a maximum of 3 lines why each of these 5 themes is stalling the agenda. This entire block should be in a card with an alert title. No introductions.”
In this way, the agent can perform complex analyses (read summaries, detect regulatory controversies, summarize reasons for delays in action plans) without imposed mathematical formulas.
The secret is to focus on the meaning of the analysis (e.g.: which actions to prioritize?) and the final visual (chart or card in the email), letting Sigalei's AI optimize the "how".
4. Ready-to-use templates to copy and paste
The templates below are reference prompts for the Sigalei agent. They ensure the best AI performance, creating impeccable designs that are 100% compatible with inboxes (Gmail/Outlook). Just adjust the words in [brackets].
4.1. Elegant executive summary
Ensure a concise text, optimized for mobile, with key terms highlighted for busy managers.
"This paragraph is part of a larger report to be sent by email. I need a stylized executive summary in Portuguese about [the main goals of the week, legislative houses, committees, and actors]. Strict restrictions: Write in a maximum of 2 paragraphs, up to 7 lines each. It must have pleasant styling for email reading: justified text, comfortable line spacing, and visual highlights (bold) on crucial terms. The entire summary must be contained within a card. Do not write introductions, greetings, or explanations. Nothing besides the summary."
4.2. Evolution chart (stacked)
Ideal for tracking volumes over time or distributed by teams/committees. The agent creates colorful bar charts, 100% safe for Outlook.
“This section is part of a stylized report on [legislative events] for next week. I need a visualization/chart showing the [events per committee] on each [business day, between Monday and Friday]. The visualization must be strictly compatible with Gmail and Outlook, using pure HTML. I want a stacked bar chart. Legends and texts in Portuguese. The entire visualization must be inside a card with rounded corners and a soft shadow. Do not write introductory texts. Nothing besides the visualization.”
4.3. Rankings
Perfect for rankings like "who approved the most" or "most debated themes", with horizontal bars and clear fonts.
“This section is part of an email newsletter. Create a visualization showing the [Top 5 Parties with the most approved projects] this month. I want a horizontal bar chart. The visualization must be 100% compatible with Gmail and Outlook, made in pure HTML. Legends in Portuguese, in pastel tones. Wrap the chart in a stylized card. Do not write texts or explanations on your part. Nothing besides the visualization.”
4.4. Task list
Transforms hundreds of complex regulatory data points into a light, elegant, and easy-to-follow list.
“This section, called 'Decision Agenda', is part of a stylized email report. I need you to bring 1 stylized block listing the [items with decision: main deliberative sessions, voting, urgencies, and plenary agendas]. Format it as a pleasant list, compatible with Gmail and Outlook (pure HTML). For the events you deem most important, include a mini summary of up to 2 lines explaining the theme and insert any useful links. Do not include the main report header, only the header of this block and the list. Nothing besides the generated block.”
4.5. Critical alert block
Ideal to highlight an urgency in the middle of the newsletter, forcing a color change in the reader's eyes.
"This is a 'Critical Alert' block that will be part of an email. Analyze the data and identify if there is any [project moving under urgent procedure]. If there is, create an eye-catching highlight card (e.g., light yellow background and thick red border), 100% compatible with Outlook (pure HTML). The card must have the title 'Attention: Urgent Procedure', followed by the project name and a quick bulleted explanation. If you find no project in this condition, write absolutely nothing. Return only the generated alert, without introductions.”
5. AI with you, not for you
Sigalei's Newsletter Agent does not replace your judgment. It is a high-precision information retriever that organizes the "big pool" of your company's disorganized documents and presents them from the perspective you define, be it legal, regulatory, or commercial.
The ultimate goal is to create an environment of reliability, where you spend less time checking data and more time making the decisions that move your organization.
Ready to configure your next report? Try different perspectives, refine your filters, and put your creativity into action.
Your new analyst is already available on the Sigalei platform.